The first version of API of CometBase
The first version of CometBase API is released. Now you can insert light curves to your own site by using special html & javascript code. Code:
<script type="text/javascript" src="http://195.209.248.207/js/jquery.min.js"></script>
<script type="text/javascript" src="http://195.209.248.207/js/lib/flot/jquery.flot.js"></script>
<script type="text/javascript" src="http://195.209.248.207/js/lib/flot/jquery.flot.time.js"></script>
<script type="text/javascript" src="http://195.209.248.207/js/API/main.js"></script>
<script type="text/javascript" src="http://195.209.248.207/js/lib/jquery.flot.axislabels.js"></script>
<script language="javascript" type="text/javascript">
get_plot({
id_comet: 1104,
time_begin: "2014-08-19 00:00:00",
time_end: "2015-02-19 00:00:00",
id_placeholder: "placeholder"
});
</script>
<div id="placeholder" style="width:600px; height:500px;"></div>
Part 1: Libraries
<script type="text/javascript" src="http://195.209.248.207/js/jquery.min.js"></script>
<script type="text/javascript" src="http://195.209.248.207/js/lib/flot/jquery.flot.js"></script>
<script type="text/javascript" src="http://195.209.248.207/js/lib/flot/jquery.flot.time.js"></script>
<script type="text/javascript" src="http://195.209.248.207/js/API/main.js"></script>
<script type="text/javascript" src="http://195.209.248.207/js/lib/jquery.flot.axislabels.js"></script>
This part contains all necessary javascript libraries. Nothing must be changed in this part. It`s recommended to use it in <head></head> tag.
Part 2: Settings
<script language="javascript" type="text/javascript">
get_plot({
id_comet: 1104,
time_begin: "2014-08-19 00:00:00",
time_end: "2015-02-19 00:00:00",
id_placeholder: "placeholder"
});
</script>
In this part you can change next parameters:
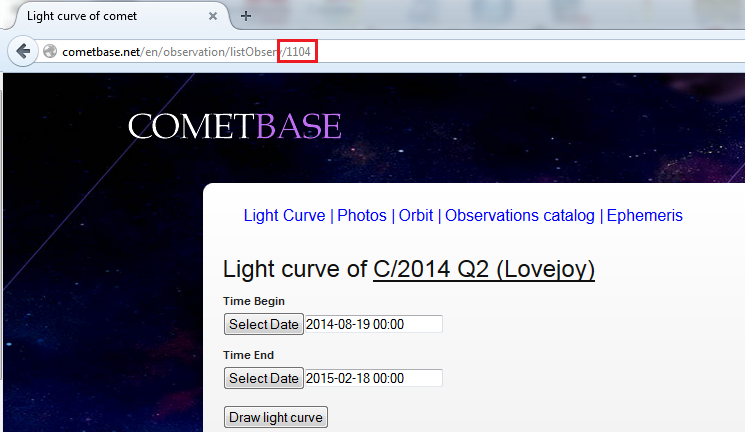
id_comet - id of comet:
time_begin - date and time of start of plot (yyyy-mm-dd hh:mm:ss)
time_end - date and time of end of plot (yyyy-mm-dd hh:mm:ss)
id_placeholder - id of container of plot
show_legend - show legend (true/false)
Part 3: Container code
<div id="placeholder" style="width:600px; height:500px;"></div>
Here you can change the settings of container of plot.
Note, that <div id="placeholder" style="width:600px; height:500px;"></div> is example container for plot, you can change the id and size.
API example: http://195.209.248.207/test.html
Kirill Grishin
back