Coma condensation diagrams
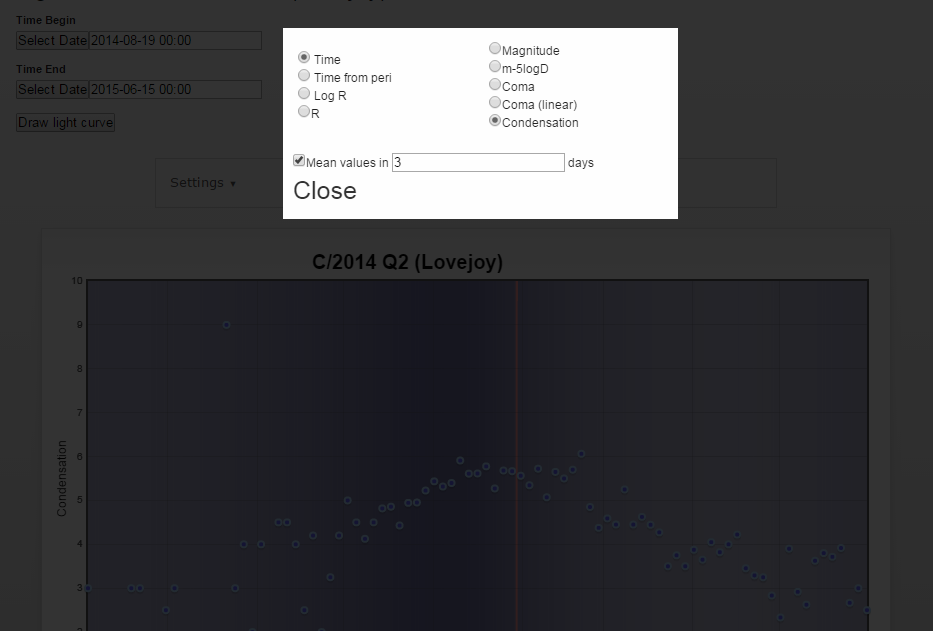
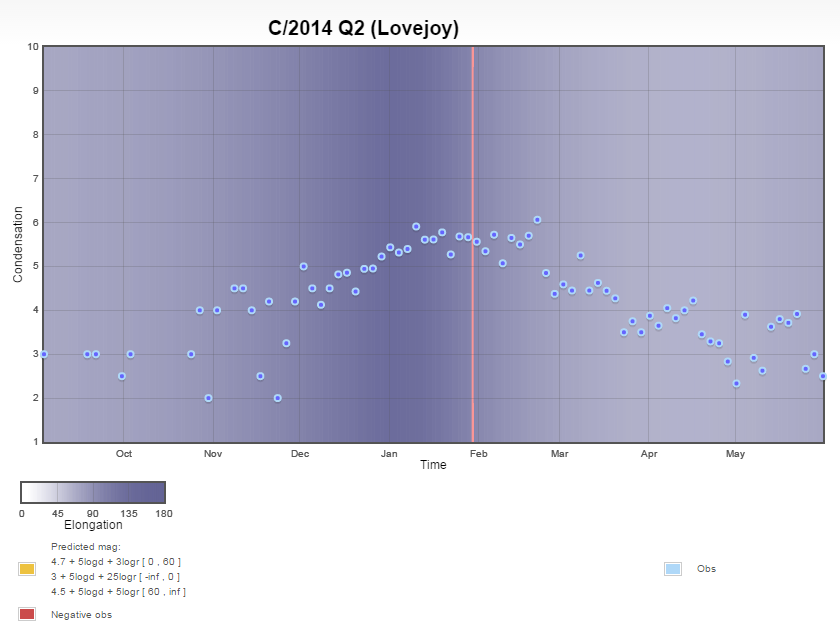
From today a coma condensation diagrams can be created in “CometBase”. To see a diagram go to the Comet Page, then select “Settings"--->"Axis” and “Condensation” option. In addition to the degree of condensation raw observational data, the average data for any number of days can be received. For example, the degree of condensation data for a comet C/2014 Q2 (Lovejoy), averaged over 3 days, can be seen in the screenshot below.
No results found.